
TADMaps: Platform interactive visualization of scientific data
category:
Product design digital
Sector:
Health, Pharmaceutical
Date:
December 2024
Client:
The Art of Discovery develops technological solutions for biomedical research. Pharmaceutical laboratories and research centers were faced with the challenge of analyzing large volumes of preclinical data using tools fragmented and little intuitive. There was a critical need for a unified platform that not only show you results, but that will guide the research process, and to facilitate the discovery of insights.
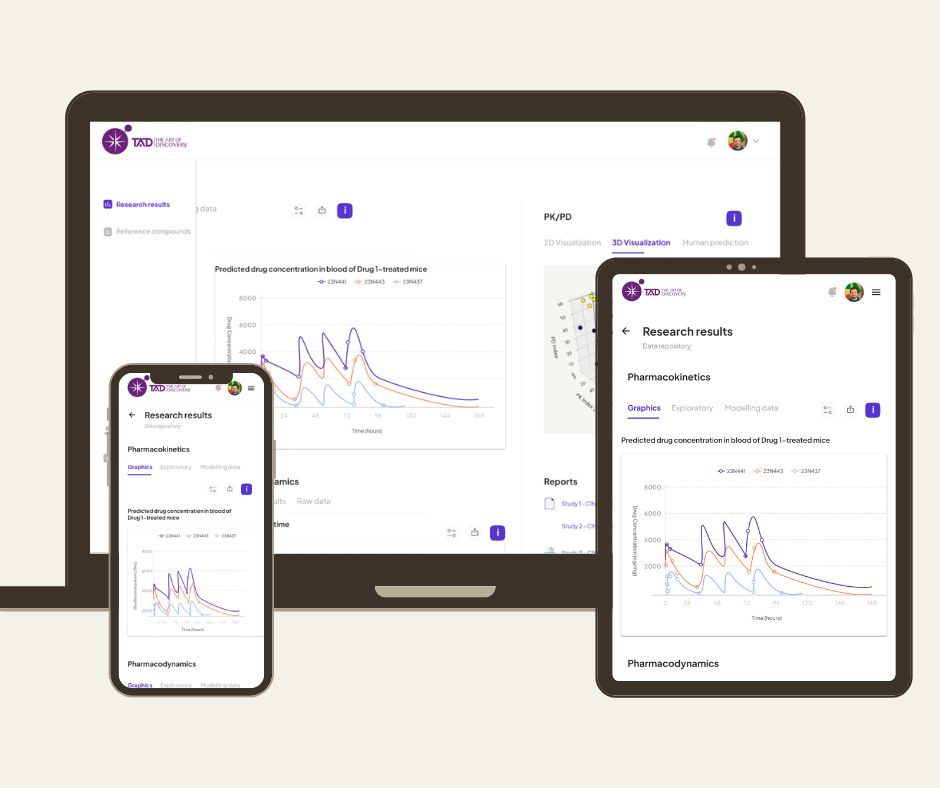
TADMaps is a software platform that transforms complex data in pharmacological research in interactive visualizations and intuitive. Designed for scientists and researchers, the platform integrates mathematical analysis patented visualization tools 2D/3D, allowing you to explore, analyze and understand experimental data more efficiently and deep.
The design challenge
The main challenge lay in the technical complexity of the pharmacokinetic and pharmacodynamic data, combined with the diversity of formats and non-standardized information sources.
Prior to the development of TADMaps, clients were delivered the already-processed results with their relevant explanations, but not the interactive data. However, a customer experience analysis revealed that enabling clients to process the data autonomously would allow them to reach new conclusions.
Furthermore, a solution was required that would allow for extrapolation to human models and offer a smooth learning curve, accessible to users with varying levels of technical expertise.


Methodology and process
The development of TADMaps followed a phased approach, starting with a deep dive in the context of the end-users.
The development process combined internal work with the support of external consultants, the move from MVP to an improved version ready for production, without losing sight of the continuous validation with real users.
Phase 1: Definition of the concept
This phase focused on a comprehensive research of scientists and the analysis of its workflows to identify critical points as the loss of time in the manual processing of data and the difficulty to correlate results of PK/PD.
These findings allowed us to define an MVP focused on essential features that provide the most immediate value, prioritizing a dashboard is unified and visualizations basic, while delayed advanced features such as full automation.
Phase 2: Product Design
Developed an information architecture based on a dashboard is unified and specialised modules, complemented with a system of search and advanced filtering.
Using wireframes, iterative , and a system of consistent design, created intuitive interfaces and interaction patterns to complex data, including visualizations 2D/3D customizable striking a balance between the analytical power with the visual clarity.
Phase 3: Development phases
The process followed an agile methodology and evolutionary, starting with the development of the MVP to validate the central hypothesis, followed by a proof-of-concept.
After collecting the first valicación of its utility, it is implemented substantial improvements in performance and functionalities, culminating in the release-to-production platform stable and scalable for widespread use.
Phase 4: Validation continuous
It established a permanent cycle of feedback by testing with real users , and the analysis of usage data, allowing iterations fast , and adapting to emerging needs. in Addition, we collected frequently asked questions to nurture the development of a chatbot future, ensuring that the platform will evolve in a manner aligned with the real demands of the researchers.


Outcome and impact
A minimum viable product (MVP) was created, incorporating the essential functionalities defined during the initial research.
The platform made it possible to test the value of this technological solution for clients, fulfilling the primary objective of validating the value proposition. It successfully demonstrated on a global scale the capabilities of TAD’s patented mathematical process, proving its applicability in real-world research environments.
As a key result, user doubts, questions, and needs for explanation were gathered. This fundamental information was specifically used to fuel the future development of a chatbot for the subsequent phase.
However, strategic decisions were made to deliberately exclude from the MVP the full automation of processing, a data interpretation assistant, and an automated guidance system for investigations. This was because the internal processes were not sufficiently standardized and required manual preprocessing of the information.
The role of design
Design played a fundamental role in transforming a complex technical problem into a usable and valuable experience for researchers.
It was not limited to aesthetics; instead, it encompassed the abstraction of the underlying mathematical complexity, the creation of intuitive flows that guide the user, and the development of a flexible visual system that adapts to different research styles.
Innovations such as TAD Vision—a type of patented visualization—and the balance between automation and manual control reflect how strategic design can make a difference in highly specialized environments, making science more accessible, understandable, and actionable.